Java interview questions and answers on asynchronous processing
|
The scenario based questions are very popular with the job interviewers, and some scenario based questions are related to decoupling and asynchronous (aka non-blocking) processing. The interviewer will give you a scenario like producing an aggregate report, designing a trading system, or building an application that requires heavy auditing, logging or custom metrics gathering. Feel free to ask the right questions as the interviewer will be more interested in how you think and approach a problem rather than you solve it instantly or not. Q. Can you describe instances where you used asynchronous processing in your application? A. The asynchronous processing is very handy for decoupling systems and for boosting performance and scalability. Here are a few examples. Example 1: An online application with a requirement to produce time consuming reports or a business process (e.g. rebalancing accounts, aggregating hierachical information, etc) could benefit from making these long running operations asynchronous. Once the reports or the long running business process is completed, the outcome can be communicated to the user via emails or asynchronously refreshing the web page via techniques known as "server push" or "client pull". A typical example would be a) A user makes a request for an aggregate report or a business process like rebalancing his/her portfolios. b) The user input can be saved to a database table for a separate process to periodically pick it up and process it asynchronously. c) The user could now continue to perform other functionalities of the website without being blocked. d) A separate process running on the same machine or different machine can periodically scan the table for any entries and produce the necessary reports or execute the relevant business process. This could be a scheduled job that runs once during off-peak or every 10 minutes. This depends on the business requirement. e) Once the report or the process is completed, notify the user via emails or making the report available online to be downloaded. |
Example 2:
If you are working in an online trading application, you may want the functionality to queue trades and process them when the stock market opens. You also asynchronously receive the order statuses like partially-filled, rejected, fully filled, etc from the stock market. The message oriented middlewares provide features like guaranteed delivery with store-and-forward mechanism, no duplicates, and transaction management for enterprise level program-to-program communications by sending and receiving messages asynchronously (or synchronously). The diagram below gives a big picture.

Example 3:
You may have a requirement for stringent logging, auditing or performance metrics gathering. Processing these non-functional requirements asynchronously and non-intrusively can make your system perform and scale better. For example, you could send the log messages to a queue to be processed later asynchronously by a separate process running on the same machine or a separate machine. The performance metrics can be processed asynchronously as well. here is a working example with relevant code snippets.
For example, a trading application may have a number of synchronous and asynchronous moving parts and metrics needs to be recorded for various operations like placing a trade on to a queue, receiving asynchronous responses from the stock market, correlating order ids, linking similar order ids, etc. A custom metrics gathering solution can be accomplished by logging the relevant metrics to a database and then running relevant aggregate queries or writing to a file system and then running PERL based text searches to aggregate the results to a “csv” based file to be opened and analyzed in a spreadsheet with graphs. In my view, writing to a database provides a greater flexibility. For example, in Java, the following approach can be used.
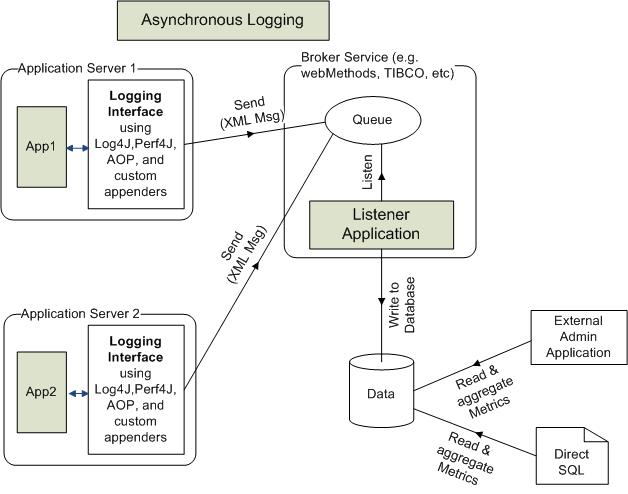
Step 1: Use log4j JMS appender or a custom JMS appender to send log messages to a queue. This ensures that your application's performance is not adversely impacted by logging activities by decoupling it.
Step 2: Use this appender in your application via Aspect Oriented Programming (AOP – e.g Spring AOP, AspectJ, etc) or dynamic proxy classes to non-intrusively log relevant metrics to a queue. It is worth looking at Perf4j and context based logging with MDC (Mapped Diagnostic Contexts) or NDC (Nested Diagnostic Contexts) to log on a per thread basis to correlate or link relevant operations. Perf4J is a great framework for performance logging. It's non-intrusive and really fills the need for accurate performance logging. The Perf4j provides features like a command line tool to generate aggregated results and graphs from raw log files, ability to expose performance statistics as JMX attributes and to send notifications when statistics exceed specified thresholds, custom log4j appenders, and AOP aspects that allow non obtrusive statements when used with Spring AOP.
The Perf4J is for
System.currentTimeMillis( );
as Log4J is for
System.out.println(.....);
Step 3: A stand-alone listener application needs to be developed to dequeue the performance metrics messages from the queue and write to a database or a file system for further analysis and reporting purpose. This listener could be written in Java as a JMX service using JMS or via broker service like webMethods, TIBCO, etc.
Step 4: Finally, relevant SQL or regular expression based queries can be written to aggregate and report relevant metrics in a customized way.
The data captured could be an Event object containing
private final String environment;           // source environment
private final Long timestamp;               // source timestamp
private final Long duration;                // sample duration
private final String thread;                // Log4j ThreadName
private final String component;             // component name
private final Stage stage;                  // enum BEGIN | END | NONE
private final String source;                // Log4j LoggerName
private final String context;               // Log4j NDC
private final String process;               // work process
private final String item;                  // work item identity (eg. orderId)
private final String level;                 // Log4j Level
private final String message;               // Log4j RenderedMessage
private final String exceptionMessage;      // Log4j Throwable Message
private final String exceptionStacktrace;   // Log4j Throwable Stacktrace
An XML based library like Xtream can be used to serialize and deserialize the messages. Here is some pseudo code in Java.
Let's look at some sample code:
STEP-1: Define the custom appender in Log4j. In Log4J, appenders are responsible for handling the output and transport of logging data ('output destinations'). There are appenders for writing log data to files, for logging over the network or to write the logging output to the terminal, just to name a few.
package com;

public class EventJmsXmlAppender extends AppenderSkeleton {
  ...
  public boolean requiresLayout( )
  {
    return true;
  }

  protected void append(LoggingEvent event)
  {
    try
     {
       //construct and the send the log metrics event to JMS queue
       JMSServiceFactory jmsService = JMSServiceFactory.getJmsServiceFactory();
       QueueConnectionFactory qFactory = (QueueConnectionFactory)jmsService.getTargetJMSConnectionFactory("jms/LogConnectionFactory",  serviceLocator);
       QueueConnection qConnection = qFactory.createQueueConnection();
       qSession qSession = qConnection.createqSession(false, Session.AUTO_ACKNOWLEDGE);
       Queue q =  (Queue)jmsService.getTargetJMSQueue("jms/EventsQueue", serviceLocator);
       QueueSender qSender = qSession.createSender(q);
       TextMessage msg =  qSession.createTextMessage();
       msg.setText(getLayout().format(event));
       qSender.send(msg);

     }
     catch(ServiceNotFoundException snfe)
     {
       //handle Exception
     }
     catch(JMSException jmse)
     {
      //handle Exception
  }
     }
     ...
}
In the log4j.xml file define the custom appender.
...
 <appender name="events" class="com.EventJmsXmlAppender">
     <errorHandler class="org.jboss.logging.util.OnlyOnceErrorHandler"/>
     <param name="Target" value="System.out"/>
     <param name="Threshold" value="INFO"/>

     <layout class="org.apache.log4j.PatternLayout">
        <!-- The default pattern: Date Priority [Category] Message\n -->
        <param name="ConversionPattern" value="%d{ABSOLUTE} %-5p [%c{1}] %m %n"/>
     </layout>
 </appender>


 <logger name="com.LoggingInterceptor" additivity="false">
      <level value="info" />
      <appender-ref ref="events" />
 </logger>

 ...
Step 2: Define the interceptor that logs metrics using the custom JMS appender. The interceptor will be invoked on actual method invocation to log the time. The interceptor will forward the request to actual method call via invocation.proceed( ) method call. After invoking the actual method, the time duration for the method execution is calculated. The LOG.info method call will be using the previously defined JMS appender.
package com;

public class LoggingInterceptor implements MethodInterceptor {

    private static final Logger LOG = Logger.getLogger(LoggingInterceptor.class);

    @Override
    public Object invoke(MethodInvocation invocation) throws Throwable {
        long begin = System.currentTimeMillis( );
        ...
        try {
          ...
          Object result = invocation.proceed( );       // run actual method
          ...
          LOG.info("Duration = " + System.currentTimeMillis( ) - begin);
          return result;
        } catch (ResponseUnavailableException e) {
            ....
            throw e;
        } catch (Throwable e) {
            throw e;
        } finally {
           ...
        }
    }

   ..

}
In Spring config file wire up the required service(s) and interceptor(s). The TradingService will be making use of the interceptor(s) to log performance metrics.
<bean id="loggingInterceptor" class="com.LoggingInterceptor" />

    <bean id="abstractService" abstract="true"  class="org.springframework.aop.framework.ProxyFactoryBean">
        <property name="interceptorNames">
            <list>
                <value>loggingInterceptor</value>
            </list>
        </property>
    </bean>


     <bean id="tradingService" parent="abstractService">
        <property name="proxyInterfaces">
            <value>com.TradingService</value>
        </property>
        <property name="target">
            <bean class="com..TradingServiceImpl">
                <constructor-arg><ref bean="..." /></constructor-arg>
                <constructor-arg><ref bean=".." /></constructor-arg>
            </bean>
        </property>
    </bean>
STEP 3: Write a stand-alone JMS listener to retrieve the XML event massages from the queue “jms/EventsQueue” and write to a database table or a file for further analysis and reporting. This can be done via a MDB (a Message Driven Bean in the EJB sepcification), a Spring based JMS listener, or a listener configured via a Message Oriented Broker like web Methods or TIBCO broker.
Labels: Core Java, Java Key Areas
posted by Unknown at
4/24/2012 03:58:00 PM
![]()
![]()

0 Comments:
Post a Comment
Subscribe to Post Comments [Atom]
<< Home